 Slovenski INSPIRE metapodatkovni sistem
denominator
100000
6 record(s)
Type of resources
Categories
INSPIRE themes
Keywords
Contact for the resource
Formats
Representation types
Scale
-
The EuroBoundaryMap collection for Slovenia is part of the European collection at 1 : 100 000 scale, which homogenously covers 55 countries.
-

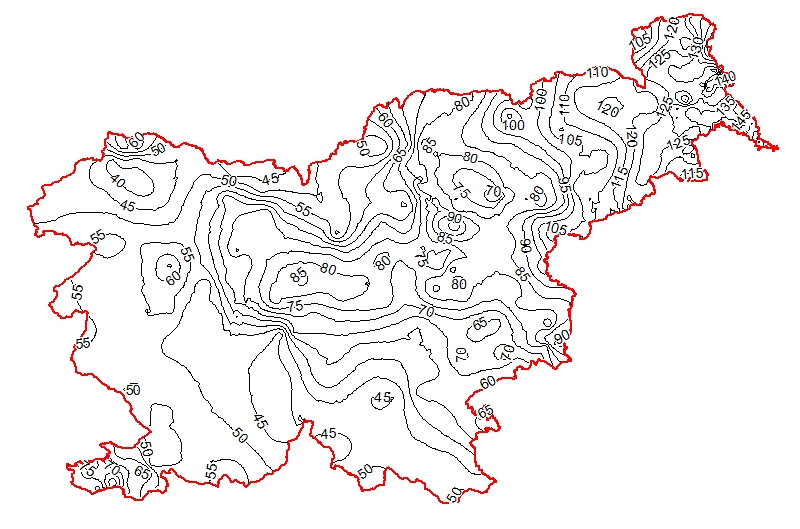
The underground geothermal conditions can be presented, irrespective of the aquifers' position, with the appropriate geothermal maps. This map represents the expected isotherms at a depth of 2000 m and is derived from Geothermal map - Expected temperatures at a depth of 2000 m, which is made with data from 240 boreholes. It is made on the basis of measured temperatures in accessible boreholes throughout the country. However, since the temperature field depends on the geological structure in the depths and tectonic characteristics, the course of the isotherms is a result of many influences, such as thermal conductivity of rocks, permeability and fracturing of rocks, all of which are reflected in the measured temperatures in boreholes. In this depth also a radiogenic heat production in the rocks has smaller influence. The distribution of boreholes, which were useful for the measurement of temperature, is very uneven and different as regard the depths. Following the expected temperatures at a depth of 2000 m a stronger positive anomaly is in the northeastern part of Slovenia, from the line Maribor-Rogatec to the east, while in the eastern part of the Krka basin the anomaly is not so much visible any more. In the northeastern part of the country the anomaly is the result of the thinning of the Earth's crust and greater conductive heat flow from the Earth's mantle.
-
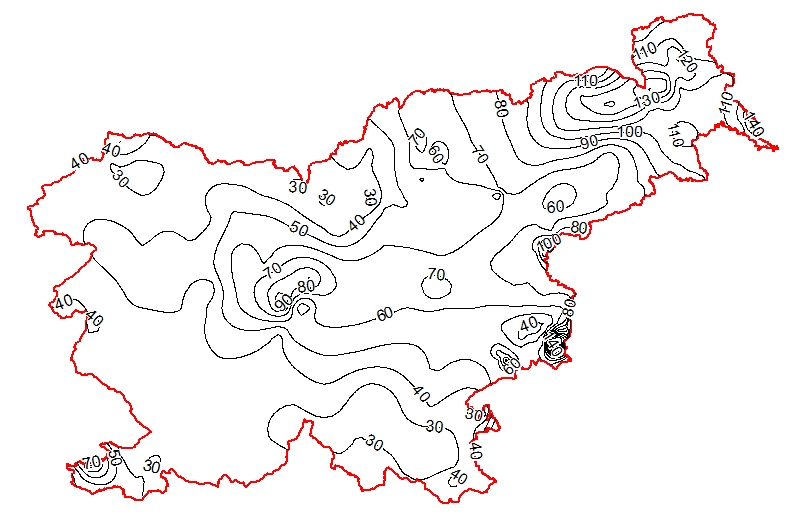
The underground geothermal conditions can be presented, irrespective of the aquifers' position, with the appropriate geothermal maps. This map represents the expected temperature lines at a depth of 3000 m and is derived from Geothermal map - Expected temperatures at a depth of 3000 m, which is made with data from 214 boreholes. It is made on the basis of measured temperatures in accessible boreholes throughout the country. However, since the temperature field depends on the geological structure in the depths and tectonic characteristics, the course of the isotherms is a result of many influences, such as thermal conductivity of rocks, permeability and fracturing of rocks, all of which are reflected in the measured temperatures in boreholes. In this depth also a radiogenic heat production in the rocks has smaller influence. The distribution of boreholes, which were useful for the measurement of temperature, is very uneven and different as regard the depths. Following the expected temperatures at a depth of 3000 m a stronger positive anomaly is in the northeastern part of Slovenia, from the line Maribor-Rogatec to the east, while in the eastern part of the Krka basin there is no anomaly any more. In the northeastern part of the country the anomaly is the result of the thinning of the Earth's crust and greater conductive heat flow from the Earth's mantle. Elsewhere temperatures are much lower.
-
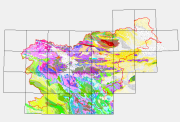
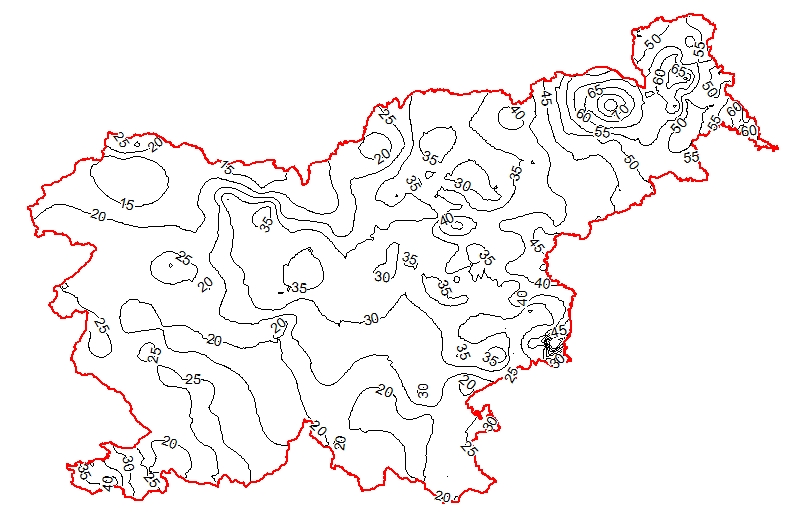
Map represents the calculated (surface) heat-flow density (HFD) in mW/m2 with topographic correction. It is made with data from 119 boreholes from the measured temperatures in the available boreholes and measured thermal conductivity on cored rock samples from the same boreholes. The pattern of the HFD isolines is affected by numerous parameters, particularly the thermal conductivity of rocks, rock permeability and fracturing, fluid content of the rocks, and all are reflected in the measured temperature gradient in the boreholes.
-
Basic geological map of Yugoslavia presents lithological and stratigraphic characteristics of rocks, their relationships, age and other. It is a key to the understanding of the geology of Slovenia. It consists of 23 sheets, scale 1: 100.000.
-
The underground geothermal conditions can be presented, irrespective of the aquifers' position, with the appropriate geothermal maps. This map represents the expected isoterms at a depth of 1000 m and is derived from Geothermal map - Expected temperatures at a depth of 1000 m, which is made with data from 302 boreholes. It is made on the basis of measured temperatures in accessible boreholes throughout the country. However, since the temperature field depends on the geological structure in the depths and tectonic characteristics, the course of the isotherms is a result of many influences, such as thermal conductivity of rocks, permeability and fracturing of rocks, all of which are reflected in the measured temperatures in boreholes. The distribution of boreholes, which were useful for the measurement of temperature, is very uneven and different as regard the depths. Following the expected temperatures at a depth of 1000 m a stronger positive anomaly is in the northeastern part of Slovenia, especially between Maribor and Murska Sobota and further to the Hungarian border and at Lendava, as well as in a smaller eastern part of the Krka basin. In the northeastern part of the country the anomaly is the result of the thinning of the Earth's crust and greater conductive heat flow from the Earth's mantle.