 Slovenski INSPIRE metapodatkovni sistem
Keyword
geologija
23 record(s)
Type of resources
Categories
INSPIRE themes
Keywords
Contact for the resource
Formats
Representation types
Scale
-
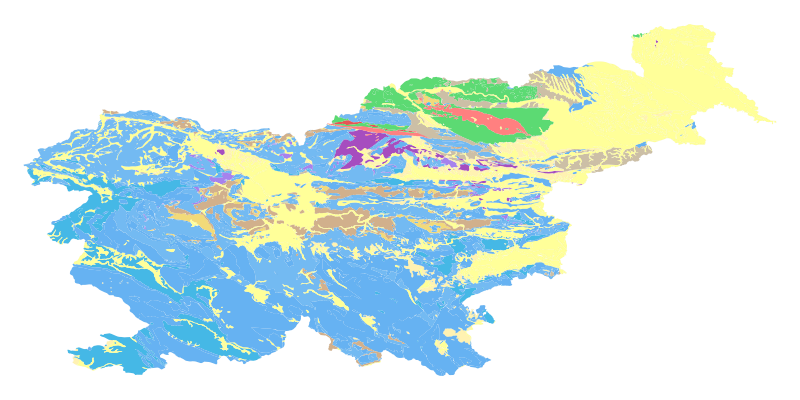
The harmonized geological map of Slovenia at a scale of 1:1,000,000 is a simplified version of the 1:250,000 scale Geological Map of Slovenia (Buser, 2009). The latter was compiled from the Basic Geological Map of Slovenia at a scale of 1: 100,000 (contributed by various authors between 1960's and 1980's and updated with new information gathered by S. Buser). The map is basically lithostratigraphic. The two layers incorporated in the map are lithostratigraphic units and major faults. The faults depicted on the map were selected using two criteria; regional extent and tectonic importance. The map presented here was edited specifically for the purpose of the OneGeology-Europe project by M. Bavec, M. Novak, M. Poljak, M. Trajanova and D. Skaberne.
-
The Basic Geological Map of Slovenia as a part of joint Basic Geological Map of SFR Yugoslavia presents lithological and stratigraphic characteristics of rocks, their relationships, age and other. It is a key to the understanding of the geology of Slovenia. It consists of 23 sheets at a scale of 1: 100,000.
-

Layer Geomorphologic Features shows the location of various types of geomorphological phenomena. Only point data are included.
-
Basic geological map of Yugoslavia presents lithological and stratigraphic characteristics of rocks, their relationships, age and other. It is a key to the understanding of the geology of Slovenia. It consists of 23 sheets, scale 1: 100.000.
-

Layer shows the zones where the rock is systematically fractured.
-

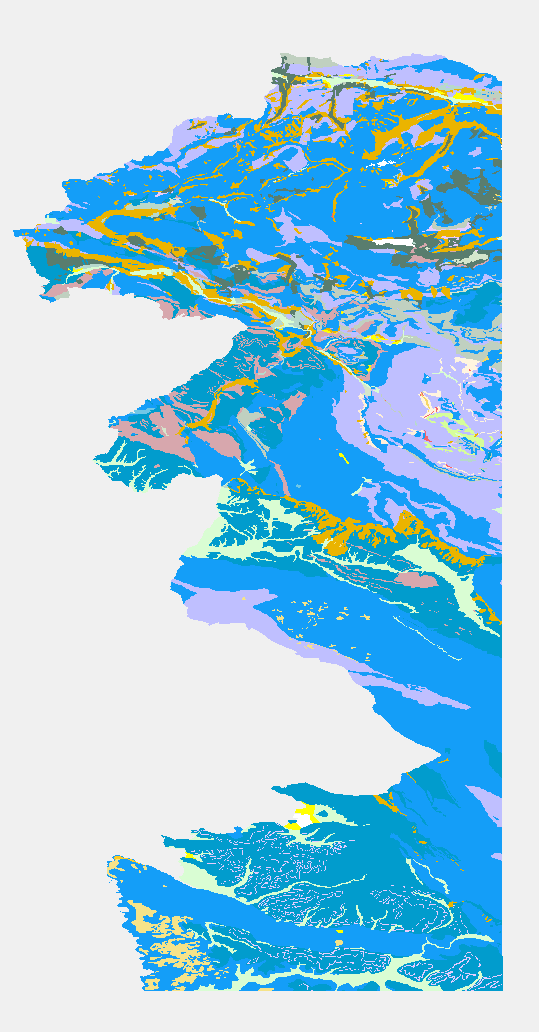
Data of Geological map were reclassified into classes of IAH classification on the base of hydrogeological characteristics. IAH classification is based on description of the hydrogeological units. Firstly, based on extensiveness and productivity and secondly on type of porosity. The purpose is to provide assistance to the strategy of groundwater exploitation as to protection and water resources management.
-
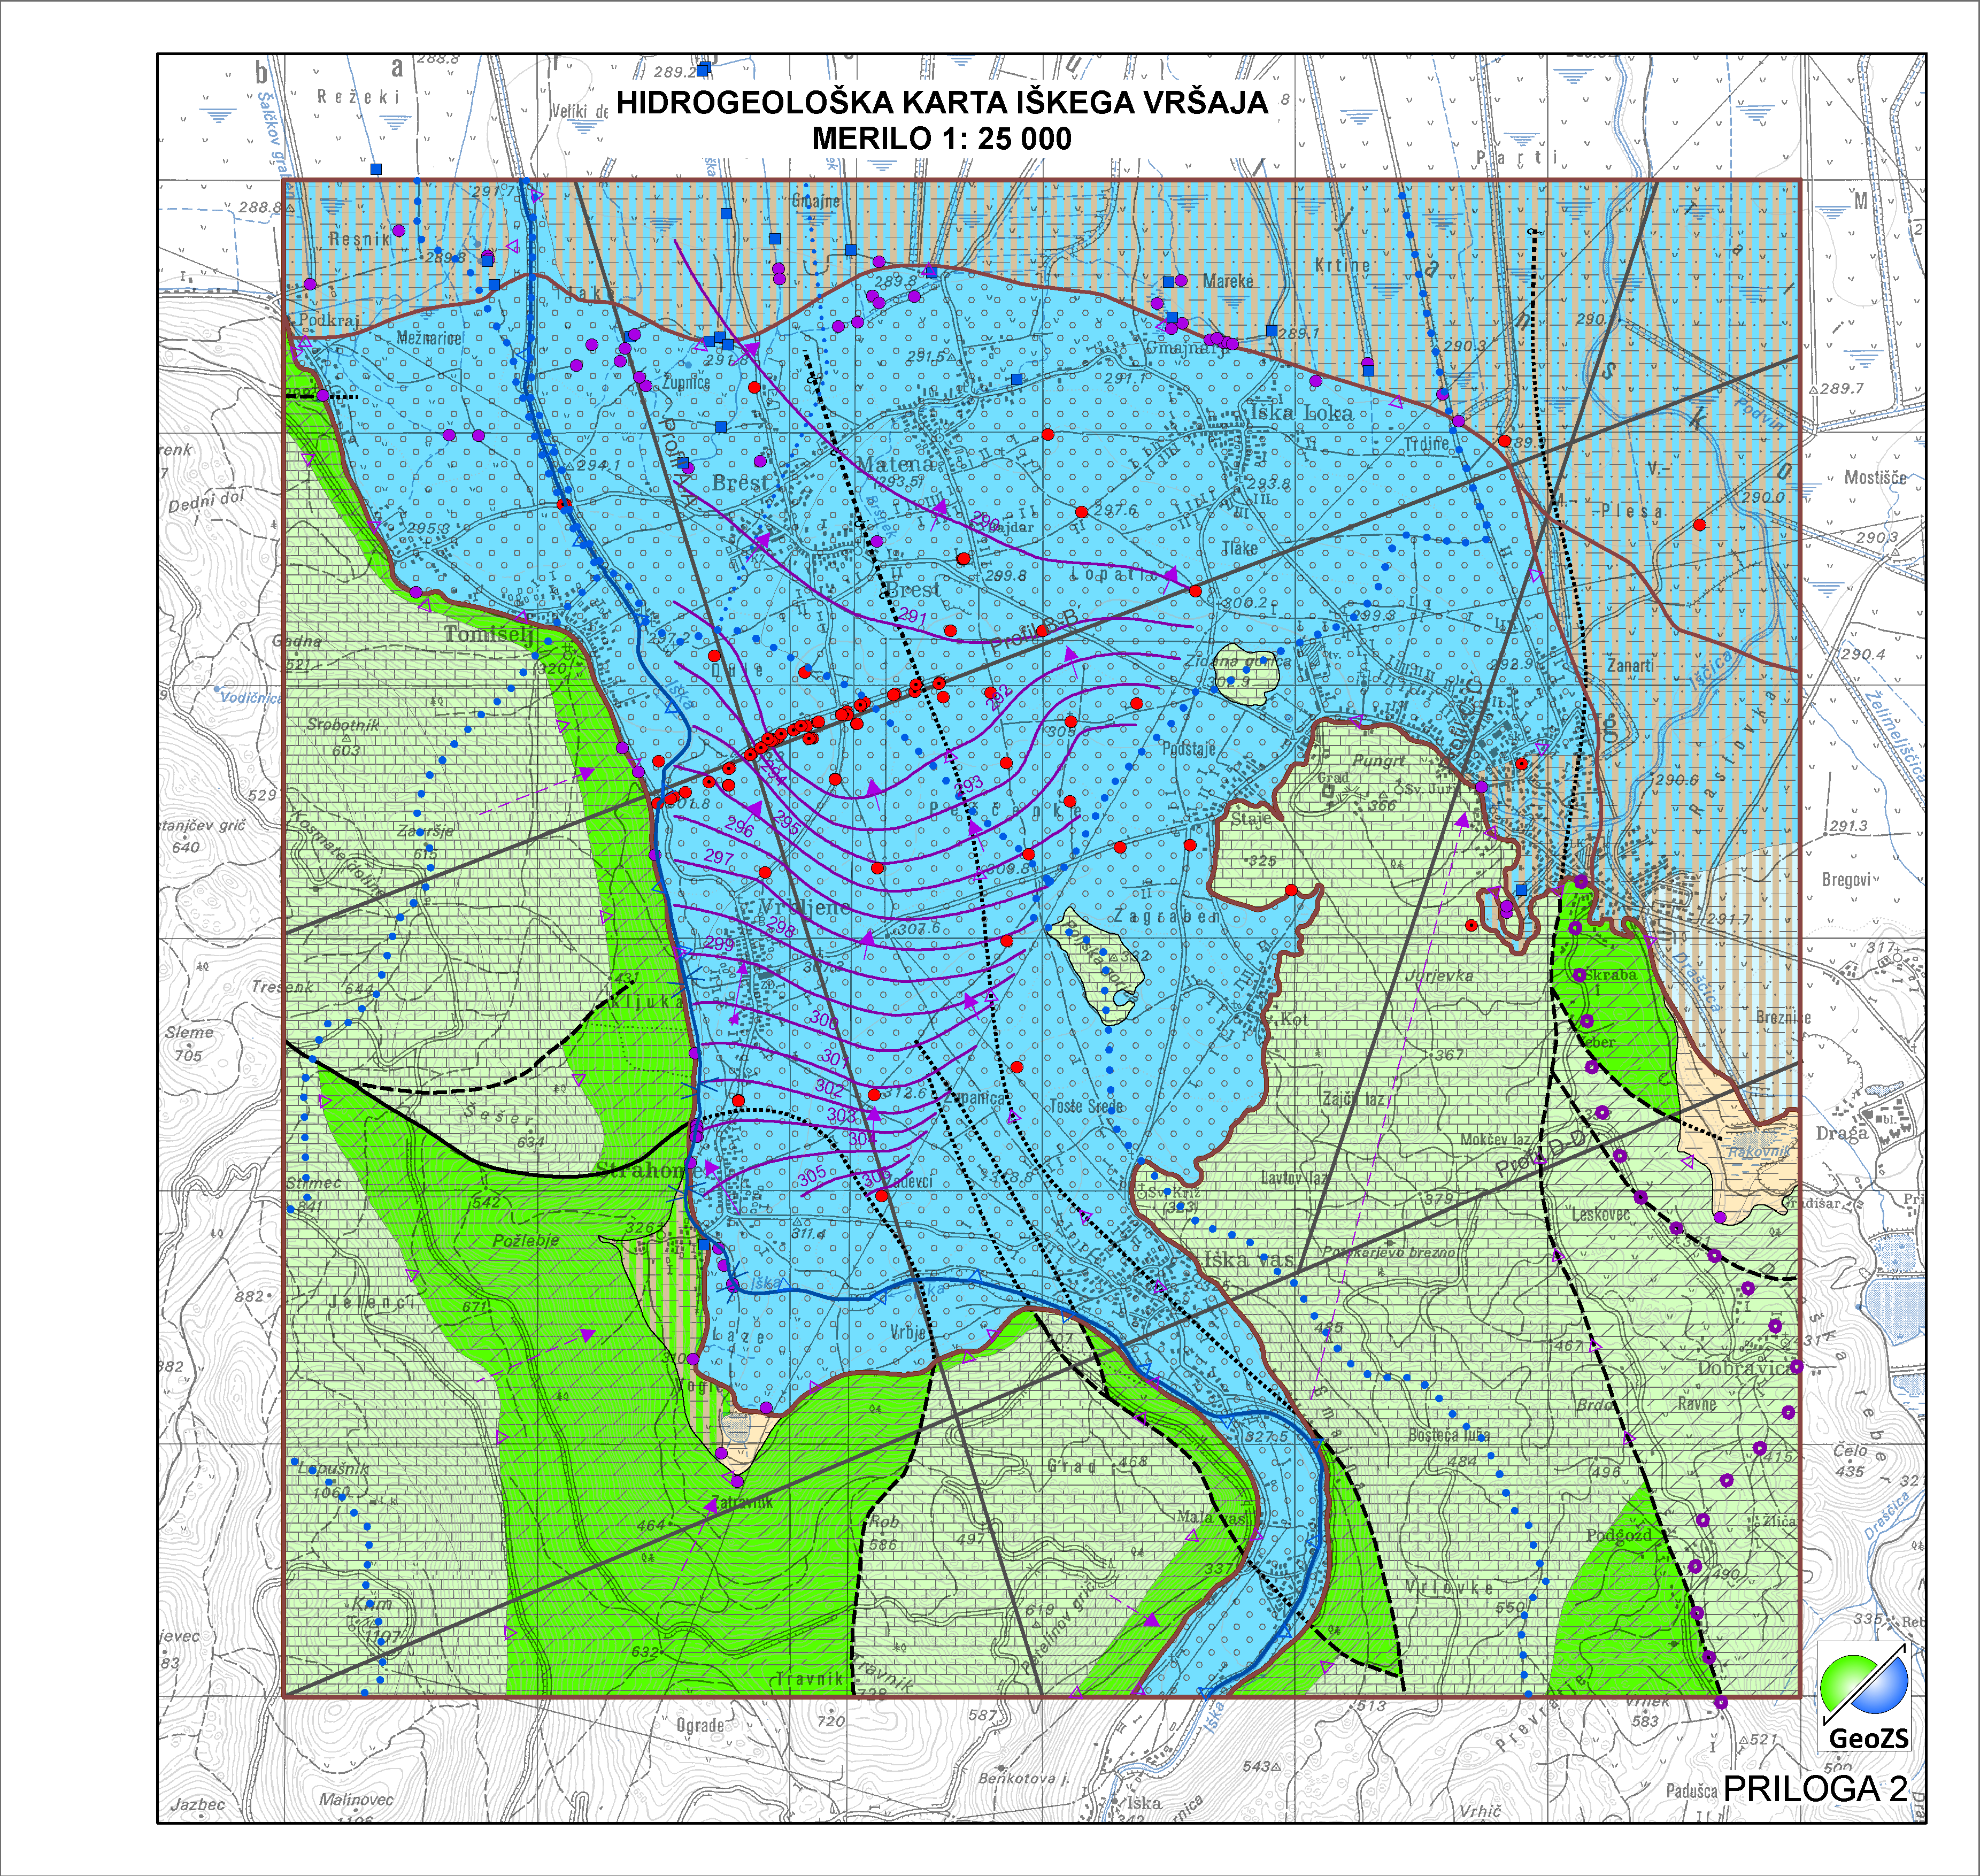
Vodonosni sistem je ozemlje z geološko zgradbo, v kateri nastopata vsaj dva različna vodonosnika, z ali brez medsebojne hidravlične povezave. Na obravnavanem območju so bile meje vodonosnih sistemov prilagojene na merilo karte 1:25.000. Namenjena so zanesljivemu ugotavljanju stanja celotne pomembne prostornine podzemnih voda v državi in doseganja okoljskih ciljev, ki jih predpisuje Vodna direktiva.
-

Geological Units are polygons, defined by equal composition (lithology) and age.
-
Geophysical cross sections show the geophysical characteristics of the sediments and bedrock at depth.
-
Product by the Pangeo project: http://www.pangeoproject.eu/ PanGeo provides information about the stability of the ground on which we live, work and play. Ground instability, or "geohazards", affect us all. They can be dangerous and costly, yet information on these phenomena can be difficult if not impossible to obtain. The PanGeo service provides entirely free access to geohazard information for many of the largest cities in Europe . The PanGeo service is aimed at local authorities, civil protection agencies, geological surveys, the public, insurers and businesses providing environmental and land reporting services. The service and products available are entirely free to use, even for commercial gain, providing appropriate credits are given (see licence terms). Information in PanGeo is derived from detailed analysis of local geological data combined with satellite measurements of ground movement.